

Included with every self-managed instance. It requires the
instance:view permission.What is this?
Instance Performance shows API latency for your instance broken down by country, so you can see how responsive your instance is for users in different regions and spot geographic performance problems.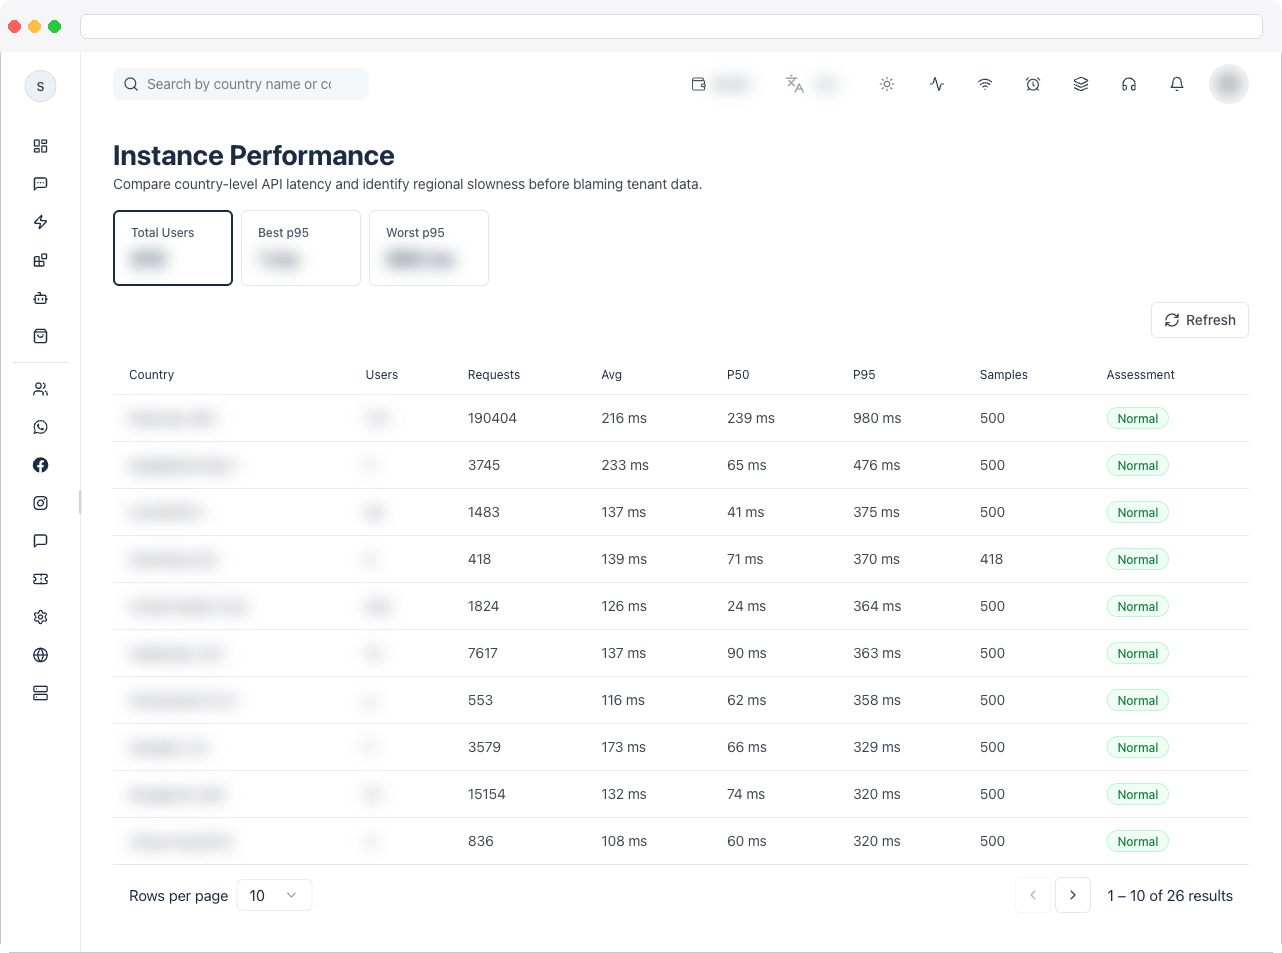
What can I do here?
- View summary tiles: Total Users, Best P95 (best 95th-percentile latency among countries), and Worst P95
- Search countries by name or country code (for example, “Malaysia” or “MY”)
- See, per country: user count, request count, average latency, P50 (median) latency, P95 latency, sample size, and an assessment (Normal, Elevated, or Severe)
- Refresh the data on demand (it also auto-refreshes every 30 seconds)
How to use it
Check latency by country
- Open Instance Performance. The table lists countries sorted with the worst-performing (highest P95) first.
- Use the search box to jump to a specific country by name or code.
- Read the Assessment column: Normal (P95 under 1200ms), Elevated (1200–2500ms), or Severe (2500ms and above).

Refresh the data
- Click Refresh in the toolbar to pull the latest latency samples immediately, instead of waiting for the automatic 30-second refresh.