

Included with every self-managed instance. This tab is part of Whitelabel Setup.
What is this?
The Stats tab gives platform owners a live, read-only snapshot of the server’s hardware usage and background job health — hostname, CPU, memory, the campaign worker, and the campaign message queue. It auto-refreshes every 5 seconds.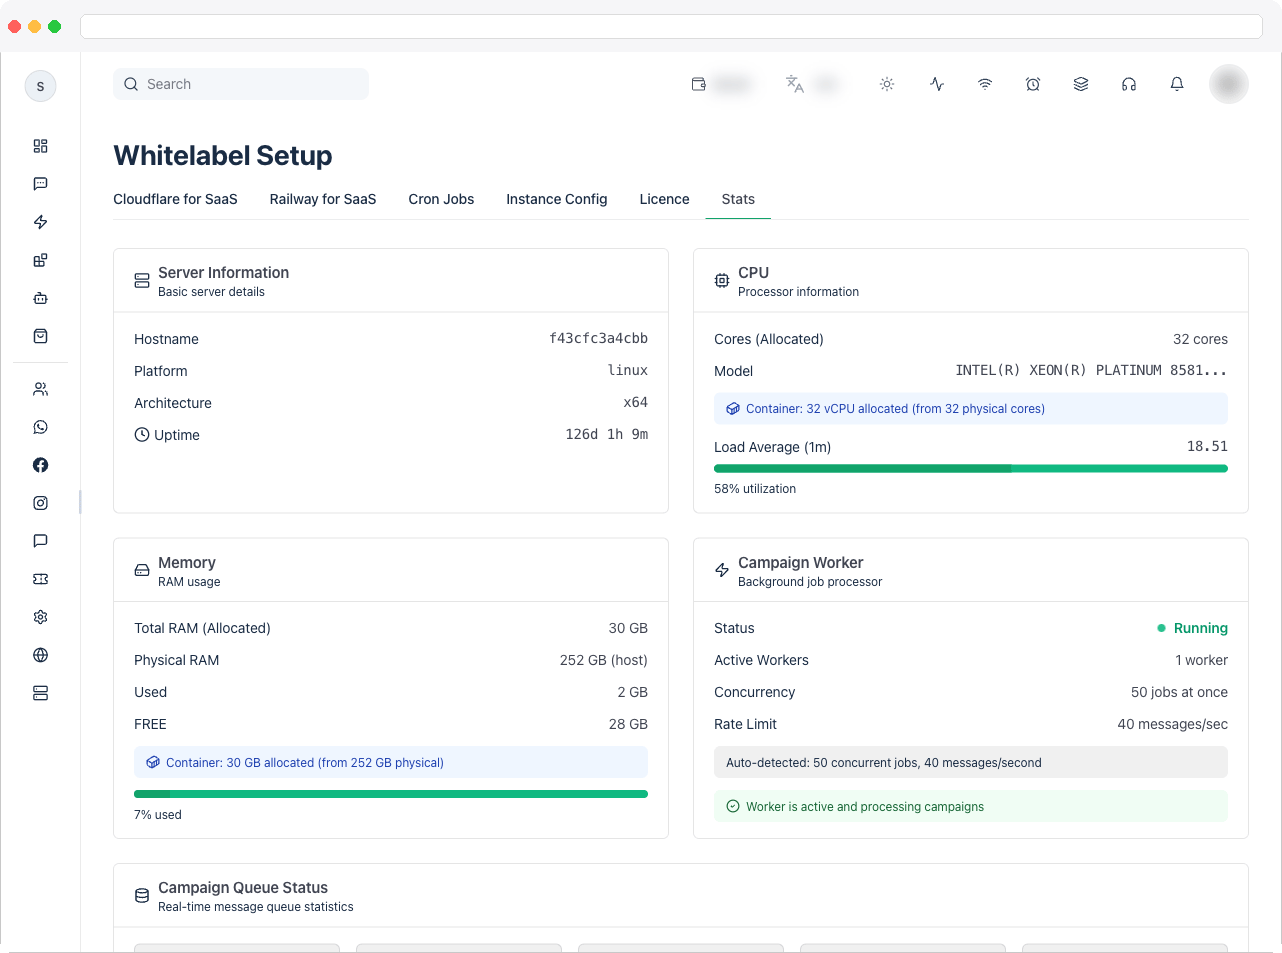
What can I do here?
This page is purely informational — there’s nothing to configure — but you can monitor:- Server Information: hostname, platform, architecture, and uptime.
- CPU: allocated cores (and physical host cores, if running in a container with different limits), processor model, current 1-minute load average with a utilization bar, and — if containerized — how many vCPUs are allocated versus the physical host.
- Memory: total RAM (and physical host RAM if different, e.g. inside a container), used, free, and a usage bar that turns yellow above 60% and red above 80%.
- Campaign Worker: whether the background job processor is Running or Stopped, how many workers are active, concurrency (jobs processed at once), and rate limit (messages/sec). If detection fails, an error/warning message is shown instead.
- Campaign Queue Status: real-time counts of Active, Waiting, Scheduled (delayed), Completed, and Failed items in the campaign queue, plus an estimated processing time for anything currently waiting.
How to use it
-
Open the Stats tab to see the four top cards: Server Information, CPU, Memory, and Campaign Worker.
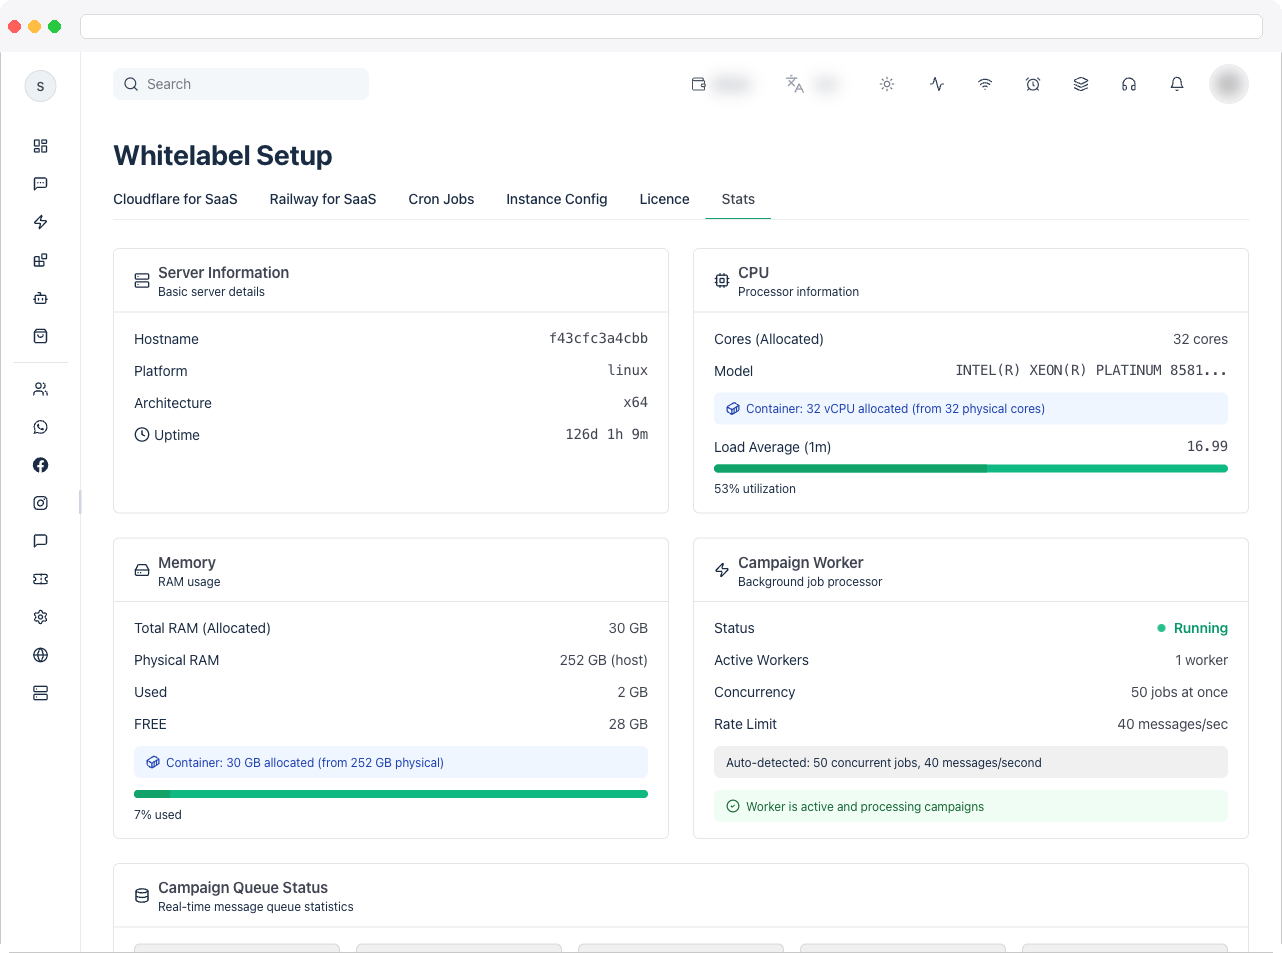
- Check the CPU and Memory utilization bars — a red bar (over 80%) signals the server is under heavy load and may need more resources.
-
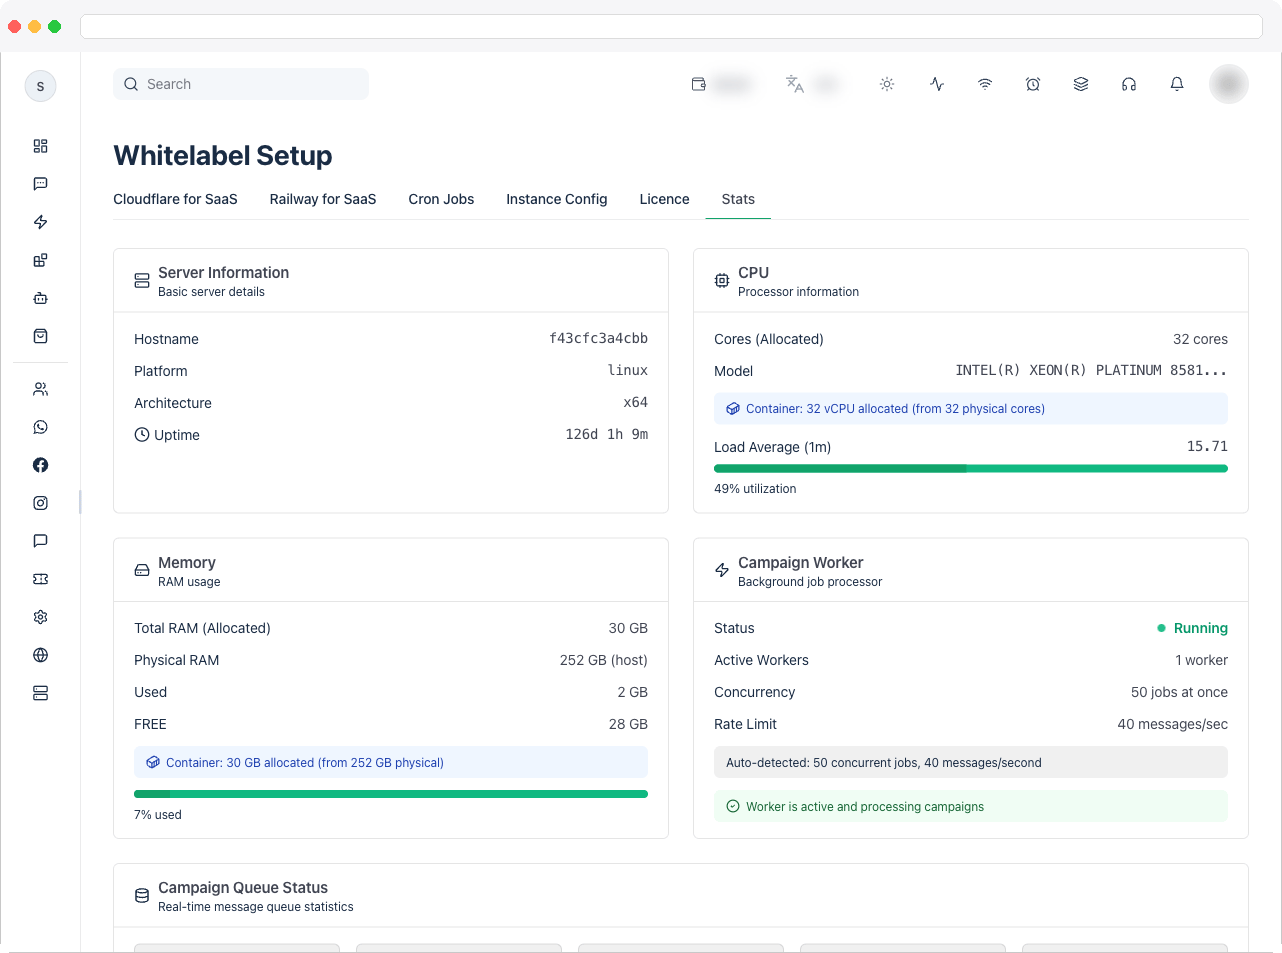
Check the Campaign Worker card’s status indicator — a green pulsing dot and “Running” means campaigns are being processed; a red dot and “Stopped” (or an error message) means campaigns won’t send until the worker issue is resolved.
-
Scroll to Campaign Queue Status to see how many messages are currently active, waiting, scheduled, completed, or failed.
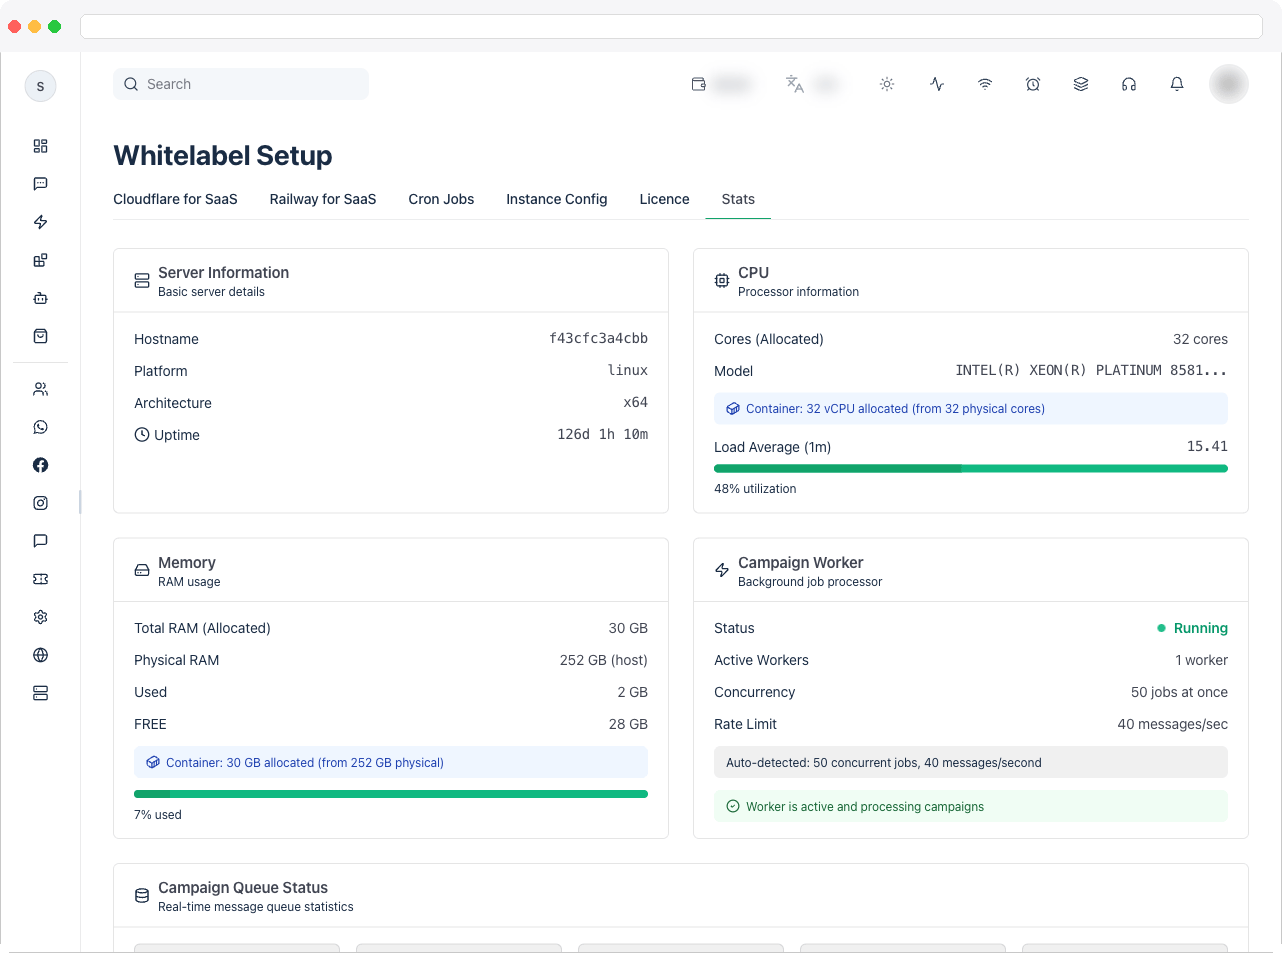
- If there’s a backlog, note the Estimated processing time shown for waiting items — it’s calculated from the current rate limit and concurrency.
- Leave the tab open to watch these numbers update automatically every 5 seconds — no manual refresh is needed.